Tibor G Szanto, Gyorgy Panyi, and their colleagues investigated the state-dependent accessibility of pore forming residues in the S6 helix of the voltage-gated Shaker K+ channel to gain insight into the molecular mechanism of slow inactivation. They employed the combination of unique techniques, such as the conventional patch-clamp technique in inside-out configuration, and exposed the channels in different gating states to thiol-reactive reagents (e.g., MTSEA and MTSET) from the cytosolic surface of the membrane. They used different Shaker K+ channel constructs with cysteines engineered into strategic positions in the S6 helix of the channel. They found that pore lining residues buried in the closed and open states of the channel become accessible for MTSEA upon slow inactivation leading to a conclusion that the communication (i.e. coupling) between the activation and the slow inactivation gate formed by the selectivity filter is mediated by molecular rearrangements in the S6 segment. The S6 rearrangements in the selectivity filter are consistent with a rigid rod-like rotation of S6 around its longitudinal axis upon slow inactivation. Since slow inactivation essentially determines the fraction of channels available to open, which is critical for excitable cells, these results provide fine details about the sequence of gating events leading to slow inactivation as well as the rate-determining step of the process, which may help in understanding arrhythmias or neurological disorders. Besides that, understanding the factors regulating the gating transitions of KV channels may also aid the design of more efficacious drugs with state-dependent binding. These results are published in the Journal of General Physiology (IF: 3.8).
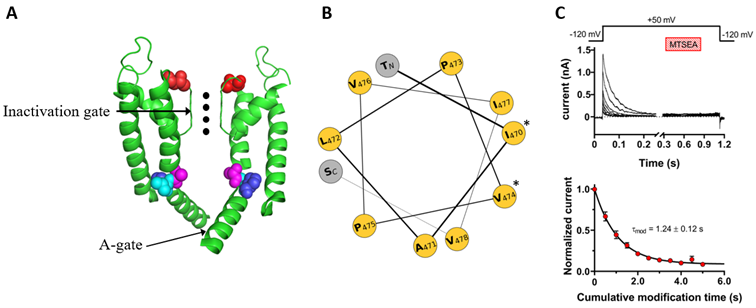
Figure. (A) Structure of the pore region of Shaker IR voltage-gated potassium channels. The S5, S6, pore helix, and pore loop segments of two diagonally opposed subunits are shown as ribbon representations with front and rear subunits removed for clarity. Colored amino acids are: T449 (red), A471 (purple), L472 (cyan), and 473 (blue). Potassium ions in the selectivity filter are illustrated by black dots. (B) Helical wheel projection of the pore domain (residues 469-479). Amino acid residues indicated by * at the right side of the helical wheel are facing the water-filled cavity in the open state. (C) Application of the cysteine modifying MTSEA to the inactivated T449A/A471C channels. (Top) Macroscopic currents were recorded using the pulse protocol shown above the corresponding raw current traces. The timing and the duration of MTSEA are indicated by the hatched bar. (Bottom) Peak currents for each pulse were normalized to the peak current of the last pulse prior to MTSEA application, averaged, and plotted as a function of cumulative modification time. The superimposed line is the best-fit to a single exponential function from which the rate of modification can be determined.