 Peptide presentation by MHC class I and MHC class II molecules plays important roles in the regulation of the immune response. One factor in these displays is the density of antigen, which must exceed a critical threshold for the effective activation of T cells. Nonrandom distribution of MHC class I and class II has already been detected at the nanometer level and at higher hierarchical levels. It is not clear how the absence and reappearance of some protein molecules can influence the nonrandom distribution. Therefore, we performed experiments on HLA II-deficient bare lymphocyte syndrome (BLS1) cells: we created a stable transfected cell line, tDQ6-BLS-1, and were able to detect the effect of the appearance of HLA-DQ6 molecules on the homo- and heteroassociation of different cell surface molecules by comparing Förster resonance energy transfer (FRET) efficiency on transfected cells to that on nontransfected BLS-1 and JY human B-cell lines.
Our FRET results show a decrease in homoassociation FRET between HLA I chains in HLA-DQ6-transfected tDQ6-BLS-1 cells compared to the parent BLS-1 cell line and an increase in heteroassociation FRET between HLA I and HLA II (compared to JY cells), suggesting a similar pattern of antigen presentation by the HLA-DQ6 allele.
Transmission electron microscopy (TEM) revealed that both HLA class I and class II molecules formed clusters at higher hierarchical levels on the tDQ6-BLS-1 cells, and the de novo synthesized HLA DQ molecules did not intersperse with HLA class I islands. These observations could be important in understanding the fine tuning of the immune response.
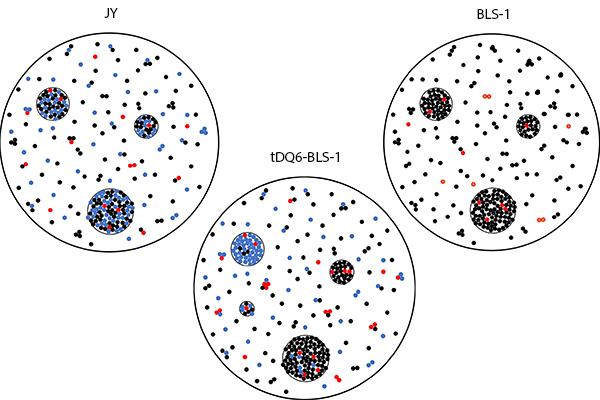
Combining our FRET and TEM data, we were able to suggest a model for the cell surface distribution of HLA class I (black spots), class II (blue spots), and ICAM-1 (red spots) molecules (see figure). In the case of JY cells, HLA class I and class II molecules form coclusters within which even ICAM-1 molecules can be found. FRET can be measured between these molecules within the clusters and outside clusters, indicating homo- and heteroassociations between these molecules. In the case of tDQB6-BLS-1 cells, HLA class I and class II molecules form separate clusters. FRET values monitoring homoassociations can come from both the clusters and from outside of clusters, but FRET values monitoring heteroassociations can come mostly from outside of clusters. Most likely, it takes a longer time for the independent HLA class I and class II clusters to intermingle, potentially weeks or months. The parent BLS-1 cells have only HLA class I clusters, and ICAM-1 molecules can be found within the clusters and outside of the clusters as well.
Authors: József Kormos, Adrienn J. Veres, László Imre, László Mátyus, Szilvia Benkő, János Szöllősi, Attila Jenei